



Your dashboard says revenue is up, the campaign report says lead volume improved, and the sales team insists pipeline quality is holding. Then profit lands flat, conversion by segment looks erratic, and no one agrees on why. That's usually the point where a top-line report stops being useful.
For marketing and sales leaders, price mix volume analysis matters because it forces a harder question than “Did revenue grow?” It asks what changed underneath the result. Did you sell more. Did you charge more. Or did customer and product composition shift in a way that changed the quality of revenue? In practice, those answers depend on clean operational data as much as they depend on finance logic. If your CRM is full of invalid contacts, role accounts, and bad signups, your view of volume and mix gets distorted before the math even starts. That's why email verification features deserve attention early, not as a cleanup task after campaigns underperform.
Decoding Your Revenue Story Beyond the Top Line
Monday morning. The revenue slide is green, the pipeline slide is green, and the room still feels wrong. Margin is flat, paid acquisition costs are up, and sales is claiming stronger demand while marketing points to better campaign performance. Finance needs a cleaner answer than "revenue increased."
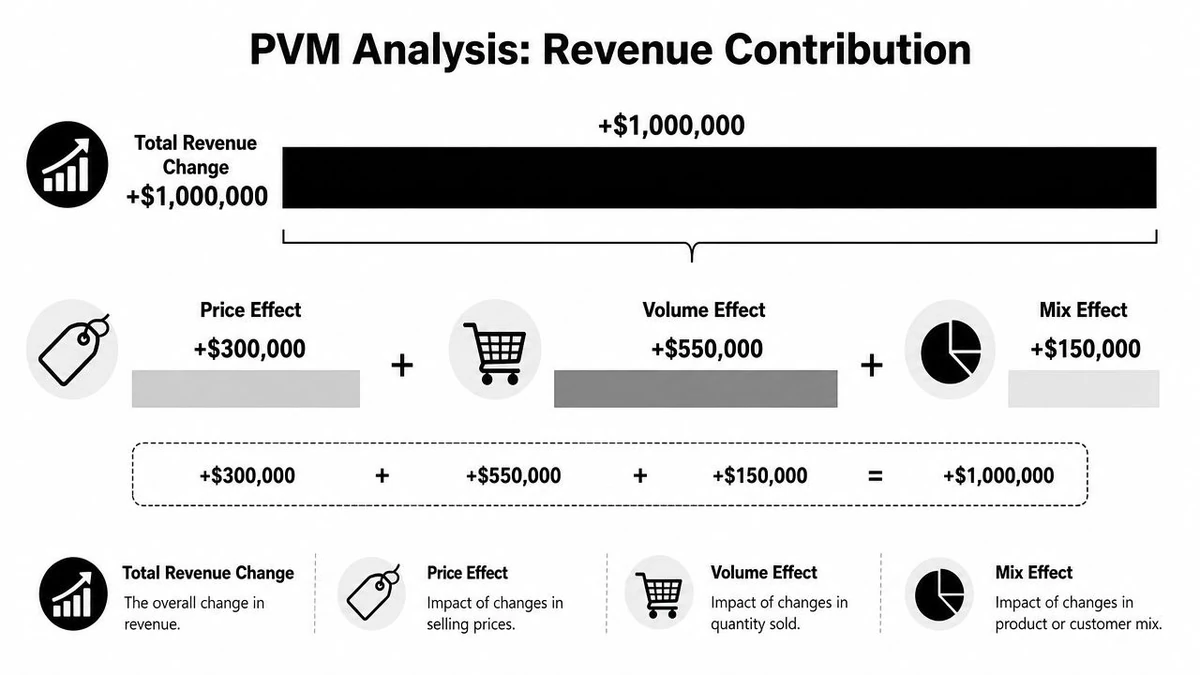
Price Volume Mix analysis gives that answer by separating one result into the operating drivers behind it. It shows whether growth came from charging more, selling more, or selling a different combination of products, packages, customers, or channels. That distinction matters because each outcome leads to a different commercial decision.
Why top-line growth confuses teams
Revenue is a summary number. It hides trade-offs.
A business can grow sales while giving up margin through discounting. It can post higher revenue because volume improved, even though the gain came from lower-quality segments with weaker retention. It can also show healthy growth because customers bought more premium SKUs or higher-tier plans, which is a very different story from broad-based demand expansion.
Marketing and sales operations feel this first. A campaign that produces more opportunities looks productive until FP&A checks conversion quality, average selling price, and product mix. If new demand skews toward smaller deals, heavily discounted orders, or channels with higher fulfillment cost, the top line overstates the commercial win.
That is why PVM works well outside traditional finance reviews. It gives marketing directors, sales leaders, and revenue operations teams a shared language for asking better questions before they shift budget, change offers, or scale a channel.
Clean inputs matter just as much as the framework. Customer segmentation, channel tagging, product mapping, and contact data all affect how volume and mix are classified. Teams that ignore data hygiene often end up debating the output instead of fixing the input. A practical example is this guide on why data cleaning is important for operational accuracy. If lead records are duplicated, email lists are decayed, or campaign responses are misattributed, your volume story gets inflated and your mix story gets distorted.
What Price, Volume, and Mix Reveal
The three drivers are simple in concept, but teams misread them all the time:
- Price shows whether average realized selling price changed.
- Volume shows whether unit sales, orders, or deal count changed.
- Mix shows whether the composition of sales shifted toward different products, packages, segments, or channels.
The practical value is in the diagnosis. In SaaS, PVM can separate a revenue increase caused by better renewal pricing from one caused by a heavier concentration of enterprise accounts. In e-commerce, it can show whether a promotion increased basket count or just shifted demand into lower-margin categories. In B2B services, it can expose when revenue growth came from selling more hours rather than improving rates or client quality.
I have seen teams give marketing credit for "demand growth" when the driver was a pricing change already pushed through by sales leadership. I have also seen finance blame weak volume when the issue was mix deterioration caused by poor lead quality and weak territory targeting. The math is straightforward. The judgment around classification, segment design, and source data is where the work sits.
For leaders who need to connect finance logic to recurring revenue planning, the 2026 guide to predictable SaaS growth is a useful companion read. It frames growth in operating terms, which is exactly how PVM should be used.
The Core Formulas Deconstructed
A revenue bridge falls apart fast when the order of operations is loose. I have seen teams calculate an average selling price first, blend product lines too early, and then dump the leftover variance into mix. That creates a clean-looking model and a bad management conversation.
A disciplined PVM analysis isolates one driver at a time. SuperfastCPA summarizes the logic well. Calculate price first, then volume, and leave mix as the residual after those two effects are stripped out.

Use the formulas in this sequence:
- Price effect = (Current Price - Previous Price) × Current Quantity
- Volume effect = (Current Quantity - Previous Quantity) × Previous Price
- Mix effect = Total Revenue Variance - Price Effect - Volume Effect
Each formula answers a different management question. Price asks whether the business realized more or less per unit sold. Volume asks whether the business sold more or fewer units at the old price. Mix captures the shift in what was sold, to whom, and through which channel.
A simple running example
Start with a single-product case before introducing portfolio effects. If a company sold 12,000 units this year at $10 per unit versus 10,000 units last year at $9 per unit, the price effect is ($10 - $9) × 12,000 = $12,000. The volume effect is (12,000 - 10,000) × $9 = $18,000. Any remaining variance after those two pieces is mix, though in a true single-product example mix should be minimal or zero unless the business changed customer, channel, or package structure.
A second example helps clarify the pricing line. If average selling price rises by $5 per unit and the business sells 10,000 units, the price effect is $50,000. That result says revenue moved because realized price moved. It does not prove customers shifted toward a richer product mix.
The distinction matters in commercial planning. Marketing may report stronger campaign performance, while sales points to improved close rates, but neither claim is complete until the bridge separates unit growth from price realization and portfolio shift.
Where teams get mix wrong
Mix creates the most debate because it is rarely captured in one obvious field. Analysts infer it from changes in product share, customer segment, channel, contract term, package tier, or territory composition. If those dimensions are messy, mix becomes a catch-all bucket.
| Driver | What changed | What stays fixed |
|---|---|---|
| Price | Selling price | Quantity and structure |
| Volume | Quantity sold | Base-period price |
| Mix | Share of products or customers sold | Captured after price and volume are isolated |
The common error is classification, not arithmetic. A discount given to one segment can look like mix deterioration if customer groups are defined poorly. A spike in low-intent leads can look like a volume win at the top of the funnel and a mix problem in closed revenue. Bad contact data contributes to both. If lead routing, territory assignment, or segment tags are polluted by invalid records, the volume and mix lines will reflect process noise rather than market behavior. Teams that rely on live go-to-market inputs usually need real-time API data workflows in place before month-end reporting can be trusted.
For a marketing director, that is the practical takeaway. Volume is not just more names or more form fills. Mix is not just a finance residual. Both depend on whether the pipeline was built from valid, correctly classified demand.
Building Your Analysis in Excel and Power BI
A PVM model usually breaks long before the formulas do. The failure point is the setup: mismatched SKU logic, unstable segment definitions, duplicate records, or CRM data that treats bad leads as real demand. If marketing is filling the funnel with unverified contacts, finance will eventually see that noise show up as false volume growth or a distorted customer mix.
Start with one decision that sounds simple but drives everything else. Choose the analysis grain and keep it fixed. That could be SKU, product family, channel, customer segment, region, or marketplace account. Once teams mix grains in the same bridge, the reconciliation still may tie, but the explanation becomes weak and hard to defend in a business review.
Set up the data model correctly
The minimum model needs the same entities across two periods with comparable price, volume, and revenue fields. Keep prior and current values side by side. Then calculate each driver in separate columns so anyone reviewing the file can trace the logic without decoding a nested formula.
A practical structure includes:
- Entity grain: Product, SKU, customer segment, region, or channel. Pick one and keep it fixed.
- Period fields: Current period and comparison period values in parallel columns.
- Calculation columns: Price effect, volume effect, and mix effect.
- Reconciliation check: Total revenue variance must equal price plus volume plus mix.
Data quality belongs in the model design, not as an afterthought. If invalid emails, duplicate contacts, or bad territory assignments enter the CRM upstream, those records can inflate campaign response, misstate segment conversion, and shift the mix analysis toward the wrong customer groups. Teams that want cleaner month-end reporting usually put real-time API data validation into their go-to-market workflows before reporting problems turn into argument-heavy forecast calls.
Build the variance view in Excel
Excel remains the fastest place to prove the logic. It is transparent, easy to audit, and good enough for most first-pass bridges. I still prefer building the first version there even when the final output will live in Power BI, because Excel exposes bad joins and classification errors quickly.
A practical build order looks like this:
- Load raw inputs first: Current and prior period price, quantity, and revenue at the chosen grain.
- Calculate each effect in its own column: Separate logic makes review easier and catches mistakes faster.
- Add a hard reconciliation test: The bridge must tie to reported revenue variance every time.
- Flag exceptions: Zero-volume rows, discontinued items, new products, and merged customer IDs need explicit treatment.
- Visualize the result: A waterfall or variance tree helps commercial teams see what changed without reading formulas.
That last point matters for cross-functional use. Marketing leaders rarely need a lecture on variance methodology. They need to see whether a campaign brought in more qualified demand, shifted the portfolio toward lower-value offers, or pushed volume into channels with weaker pricing power. The same logic is useful in retail and marketplace settings where teams are trying to maximize Amazon margins without confusing promotional volume gains with real pricing strength.
A short walkthrough helps if your team prefers a visual example:
Scale the logic in Power BI
Power BI earns its place once the bridge needs to refresh across categories, sales teams, regions, or campaign cohorts. The benefit is consistency. Finance, sales, and marketing can all work from the same definitions instead of trading spreadsheet versions over email.
The trade-off is control. A clean-looking dashboard can hide weak base-period logic, duplicate dimension keys, or measures that calculate correctly at one level and fail at another. Weighted averages and hierarchical mix analysis are where many models go wrong. If the Excel version does not reconcile cleanly, the Power BI version will only hide the problem better.
Build the bridge in Excel first. Then move the tested logic into Power BI with controlled measures, locked calendar definitions, and explicit handling for new and discontinued items.
For marketing and sales operations, that discipline changes the conversation. Instead of debating whether top-of-funnel growth was "good," teams can isolate whether verified demand increased sold volume, whether the customer mix improved, and whether price held after the pipeline moved through the conversion process.
Interpreting Results to Drive Business Strategy
A finished bridge doesn't make decisions. It only sharpens them. The useful question is what each pattern tells you to do next across pricing, demand generation, and portfolio management.
How to read common outcome patterns
A strong price effect with weaker volume often means the market tolerated pricing better than expected. That can be a good result if retention holds and sales isn't replacing lost demand with heavy discounting elsewhere. It can also be a warning sign if customer acquisition slows in lower-funnel channels.
A positive volume effect with weak or negative price usually points to one of two stories. Either marketing expanded demand efficiently, or the business bought volume through promotions and concessions. Those are not the same outcome. Finance should test whether the volume gain preserved margin quality.
A negative mix effect deserves more attention than it usually gets. In plain language, the business sold more of the wrong things, or won more of the wrong customers. That might show up as increased revenue with weaker profitability, heavier support burden, or lower repeat purchase potential.
What marketing and sales should do next
In a multi-product business, broad averages hide too much. As Zebra BI notes, for multi-product environments, PVM analysis must be executed hierarchically by calculating effects for each category before aggregating. When comparing effects on sales versus cost of sales (COS), if the value of an effect on sales exceeds its value on COS, gross margin in value grows, providing a clear indicator of profitability drivers.
That changes how teams should respond:
- If price is driving growth: Review discount governance, sales compensation behavior, and elasticity by segment.
- If volume is carrying the result: Check whether lead quality, repeat behavior, and fulfillment capacity support that growth.
- If mix is deteriorating: Revisit targeting, merchandising, product bundles, and channel strategy.
For e-commerce and marketplace teams, pricing strategy often needs a tighter link between promotional decisions and margin quality. A practical resource on how to maximize Amazon margins fits here because it frames price decisions in profitability terms, not just sales rank terms.
Marketing leaders should also compare PVM outcomes with campaign-level engagement and conversion data. A disciplined email analytics reporting workflow helps connect commercial activity to actual customer quality rather than vanity metrics.
The best use of PVM isn't explaining last month. It's stopping the next bad decision before budget gets committed.
How Data Quality Affects Your Volume and Mix Analysis
Data quality is often treated as a CRM admin problem. It's not. It's a revenue interpretation problem. If the inputs are wrong, the bridge is still mathematically correct, but it explains the wrong business.
Bad contact data changes the analysis
Volume and mix both depend on record quality. When a database contains invalid emails, disposable addresses, duplicates, or generic role accounts, the commercial funnel gets overstated. Marketing sees more leads than it can reach. Sales sees audience segments that aren't made up of real buying contacts. Finance later inherits the distortion as if it were a genuine demand signal.
That distortion is especially dangerous in segment analysis. If a large share of new “customers” in a campaign cohort are unreachable or low-intent signups, your mix view becomes less about customer behavior and more about database contamination.

The operational fix is straightforward. Validate records before they spread through automation, attribution, and reporting. BillionVerify is a professional email verification service built to solve one problem: bad email data costs businesses money.
Why email verification belongs upstream
The feature set matters because it changes the quality of what enters the system. According to Comparateur-IA, BillionVerify delivers 99.9% SMTP-level accuracy across single checks, bulk list cleaning, and real-time API validation, returning structured JSON responses that include status, SMTP results, MX records, catch-all scoring, and deliverability insights.
Those capabilities map directly to operational control:
- Single checks: Useful when sales or support teams need to verify individual records before outreach.
- Bulk list cleaning: Better for database audits, re-engagement lists, and old CRM segments.
- Real-time API validation: Best when you want to stop bad data at form submission instead of cleaning it after campaigns go live.
That last point matters most for price mix volume analysis. If invalid or low-quality records enter your system, the volume line gets inflated and the mix line gets skewed across channel, segment, or customer type. By the time finance reviews revenue variance, the underlying audience definitions are already compromised.
A solid CRM data cleaning process reduces that risk because it treats hygiene as part of revenue operations, not as a mailing-list chore.
Clean email data doesn't just improve deliverability. It protects the integrity of the business story you tell with volume and mix.
Advanced Applications and Common Pitfalls
The framework gets more useful when you apply it outside standard monthly reporting. It can explain the economics of a promotion, the quality of outbound campaigns, or the hidden trade-offs inside a channel push. It can also mislead you quickly if the data grain is wrong.
Using PVM on campaigns and promotions
An e-commerce promotion is a good test case. Sales lift during the promotion might look strong, but PVM can separate three realities: lower prices drove demand, unit volume increased, or customer baskets shifted toward lower-value items. Marketing can then judge whether the campaign created profitable demand or merely pulled forward lower-quality sales.
Outbound campaigns work the same way. A sequence may increase meetings and opportunities, but the mix question remains: did the campaign bring in the kind of accounts your business wants? If not, the pipeline is fuller without becoming more valuable.
Teams trying to tighten campaign quality usually benefit from improving source-system integrity, especially when outbound and lifecycle tools feed the same CRM. A practical example is connecting verification with automation and segmentation through CRM integration for email marketing and stronger engagement ROI.
What to do when SKU-level data is missing
One of the least discussed operational problems is incomplete granularity. As noted in this FP&A discussion on Reddit, a key underserved angle in PVM content is how to decompose effects when SKU-level data is unavailable. Practitioners often must aggregate to category level, which can blur price and mix effects, a problem faced by 42% of mid-sized retailers due to legacy POS systems.
That has two consequences.
First, you may need to report a combined price mix effect instead of pretending the drivers are cleanly separated. Second, you need to say that limitation out loud. A less precise model is still useful if decision-makers understand where the blur sits.
Common pitfalls show up in familiar forms:
- Averaging too early: Weighted averages flatten category-level reality.
- Using inconsistent periods: Seasonality can masquerade as performance change.
- Treating residuals as truth: A calculated mix line is only as good as the assumptions upstream.
- Ignoring data hygiene: Bad CRM records distort demand signals before finance sees them.
A good PVM model doesn't just calculate variance. It states what the business can know confidently, what it can only estimate, and where operational cleanup will improve the next read.
If your team is trying to connect campaign performance, CRM hygiene, and revenue analysis, BillionVerify fits at the point where bad records first enter the system. Its email verification features can help marketing, sales, and ops teams reduce invalid contacts before those records distort volume reporting, customer segmentation, and the mix assumptions behind your next PVM review.