



You're staring at a dashboard that says one thing, while finance closes the month with another. The sales team points to booked deals, marketing points to attributed conversions, and accounting points to the final number that survives returns, discounts, and timing cutoffs. If you need to know how to calculate sales revenue in a way that reconciles all of those views, the math is simple, but the workflow around it is where most reports go off the rails.
The practical fix is to treat revenue as a sequence, not a single multiplication. Start with gross sales, then subtract the deductions that belong in the period, and only then roll totals up by product, service, channel, or recurring contract. Clean source data matters just as much as the formula, which is why teams that care about reporting accuracy also care about B2B lead verification strategies and CRM hygiene before they ever touch the workbook.
Why Your Sales Revenue Number Feels Wrong
The number looks fine until someone asks where it came from. A marketer sees booked revenue in a dashboard, finance sees a lower close number, and the gap usually comes from period timing, missing deductions, or transactions that never should've been counted in the first place. The basic formula is still the starting point, but it only describes the top layer of the calculation, not the final reportable figure, which is why the same business can appear healthy on one screen and underperforming on another. For a clear distinction between gross and net, HelpWithMetrics on net revenue is a useful companion read.
Gross sales and net sales are not interchangeable
Gross sales revenue is the raw figure, the total you get before adjustments. Net sales revenue is what remains after returns, allowances, and discounts are removed, and that distinction matters because a business can book strong gross sales while reporting much less net revenue. The difference isn't cosmetic. It changes commissions, forecasts, and the confidence leaders place in the number.
Practical rule: don't open the spreadsheet until the accounting period is locked. If the cutoff is fuzzy, the revenue figure will be fuzzy too.
That's why I start with three questions before I trust any report. What exact period are we measuring. Which transactions are completed. Which deductions belong in that same period. If a team can't answer those quickly, the issue usually isn't the math, it's the input discipline.
The same goes for source data. If the CRM contains duplicates, stale contacts, or unverified leads, sales reports can look more active than they are. That's why operational teams often pair revenue review with data-quality checks and tools such as B2B lead verification strategies before they sign off on the number.
The Core Revenue Formula Explained
The core math stays the same across models. For products, it's units sold × average unit price. For services, it's customers served × average service price. The formula appears simple because it is simple, but the hard part is making sure you're using the right unit count, the right price, and the right period.
A clean way to think about it is to separate the gross build from the net report. First calculate the raw sales amount line by line. Then subtract adjustments later. That order keeps the workbook readable and avoids the common mistake of mixing deductions into the base formula.
A small catalog example
Say a business sells two products in the same month. Product A sells 500 units at $10 each, which produces $5,000 in gross sales. Product B sells 200 units at $15 each, which produces $3,000. The combined gross sales revenue for that period is $8,000 before any deductions.
The exact same logic works for services. If a consulting team serves a set of customers at an average fee, the revenue is still quantity multiplied by price, just with the quantity expressed as customers or billable units. That's why the formula is taught as the basic arithmetic of revenue measurement rather than a niche accounting trick.
Revenue only means something when the period is explicit. A monthly number, a quarterly number, and an annual number can all be correct at the same time.
For teams that build their reports in SQL or a warehouse, the aggregation step matters just as much as the formula itself. A practical overview of that roll-up logic sits in the email marketing bible analytics, especially when the same dataset feeds multiple views.
Worked Examples for Single Transactions and Time Periods
A revenue formula feels abstract until you run it against a real period. The cleanest way to do that is to keep the period fixed and change only the model. A one-month retail close and a one-quarter SaaS close both use the same units-times-price logic, but the unit definition changes, and the reporting cadence changes with it.
Retail for one month
A retail team closes the month with three product lines. One line sells 120 units at $25, another sells 80 units at $40, and the third sells 50 units at $60. The gross math is line by line, then summed, because that's the only way to see where the value came from.
- Line 1: 120 × $25 = $3,000
- Line 2: 80 × $40 = $3,200
- Line 3: 50 × $60 = $3,000
Total gross sales revenue for the month is $9,200 before deductions. If one line has returns or discounts, those are removed after the gross figure is built, not before.
SaaS for one quarter
A subscription team measures the quarter differently. It may track subscribers, contract value, or recurring revenue metrics, depending on how the business sells. The recurring model is still grounded in revenue per customer or contract, but the period becomes part of the calculation itself because the value accumulates over time.
For example, if a contract covers several months in the quarter, the quarter's revenue is the portion earned in that period, not the full contract value dropped into one month. That's the practical difference between a one-time sale and a recurring commitment.
When teams work from a data warehouse, a straightforward aggregation routine helps prevent double counting. The guide to SQL aggregate functions is useful for anyone who needs to sum revenue cleanly across rows without turning a report into a guessing game.
A good workbook separates the line item from the summary. That makes it easier to isolate a high-value deal, a renewal, or a one-off sale without burying it inside the blended total. For broader benchmarking, BillionVerify's email benchmarks can help teams compare contact-quality trends against their own historical reporting patterns, even when the revenue math itself stays unchanged.
Adjusting for Returns, Allowances, and Discounts
Gross revenue is the optimistic number. Net revenue is the number that survives review. The gap between the two is where many reporting errors hide, because teams either forget to subtract something or subtract it twice. The safest approach is to treat returns, allowances, and discounts as separate layers.
Subtract in the correct order
Returns reduce revenue because the customer sent the product back or the service was reversed. Allowances reduce revenue because the business kept the sale but compensated the customer for a problem. Discounts reduce revenue because the customer paid less than list price. Those are different events, and they should be tracked differently in the workbook.
| Adjustment | What It Represents | Effect on Net Revenue |
|---|---|---|
| Returns | Reversed sales that no longer count as completed revenue | Subtract from gross sales |
| Allowances | Price reductions granted after a problem or dispute | Subtract from gross sales |
| Discounts | Reduced selling price agreed at the point of sale | Subtract from gross sales |
That sequence matters because mixing them together can create a false recovery story. If a team nets returns against new sales without labeling them as reversals, the period can look stronger than it is. The report should show gross, then each deduction, then net.
What belongs in the deductions
Only subtract items that belong to the business's sales revenue calculation. If a charge is a pass-through tax or fee, it shouldn't be folded into top-line revenue in the first place. If a quote is still pending, it isn't revenue yet. If a transaction lands outside the period cutoff, it belongs in a different report.
The workbook should tell the same story as the invoice trail. If it doesn't, the discrepancy usually sits in the deductions column, not the multiplication step.
A dependable close process checks each deduction against source records before the final number is published. That habit catches the small leaks that make finance and sales argue about a total that should have reconciled in the first place.
Calculating Revenue by Channel and Campaign
Don't just need a total. You need to know whether direct sales, e-commerce, partner referrals, or subscriptions carried the number, and whether a campaign tag belongs in the story. The right way to do that is to tag each transaction at the source, then roll the same gross-minus-deductions logic up by channel and campaign.

Use the same workbook logic across every channel
Start with a transaction table that includes date, channel, campaign, units, price, returns, allowances, and discounts. Then calculate gross revenue per row, subtract the deductions, and sum the net by tag. The method doesn't change just because the channel changes.
A spreadsheet formula might look like this in plain English.
- Gross revenue per row: units × price
- Net revenue per row: gross revenue - returns - allowances - discounts
- Channel total: sum of net revenue where channel equals the target value
- Campaign total: sum of net revenue where campaign equals the target value
That structure works whether the source is a storefront order, a partner lead, a SaaS subscription, or a one-time service engagement. It also helps prevent the common mistake of blending channels that have different return patterns or different billing timing.
A CSV-friendly way to think about it
If the data export is flat, keep the fields explicit and sortable.
- Date
- Channel
- Campaign
- Units Sold
- Price
- Returns
- Allowances
- Discounts
- Net Revenue
Once those columns exist, the revenue report becomes a simple aggregation exercise instead of a manual reconciliation project. That's especially helpful when the same business uses direct sales, e-commerce, partner channels, and subscriptions in one reporting stack.
A clean contact record also matters here because channel attribution depends on trustworthy source data. If CRM entries are messy, the channel split gets messy too, and the campaign report stops being useful.
Common Pitfalls and Verification Habits
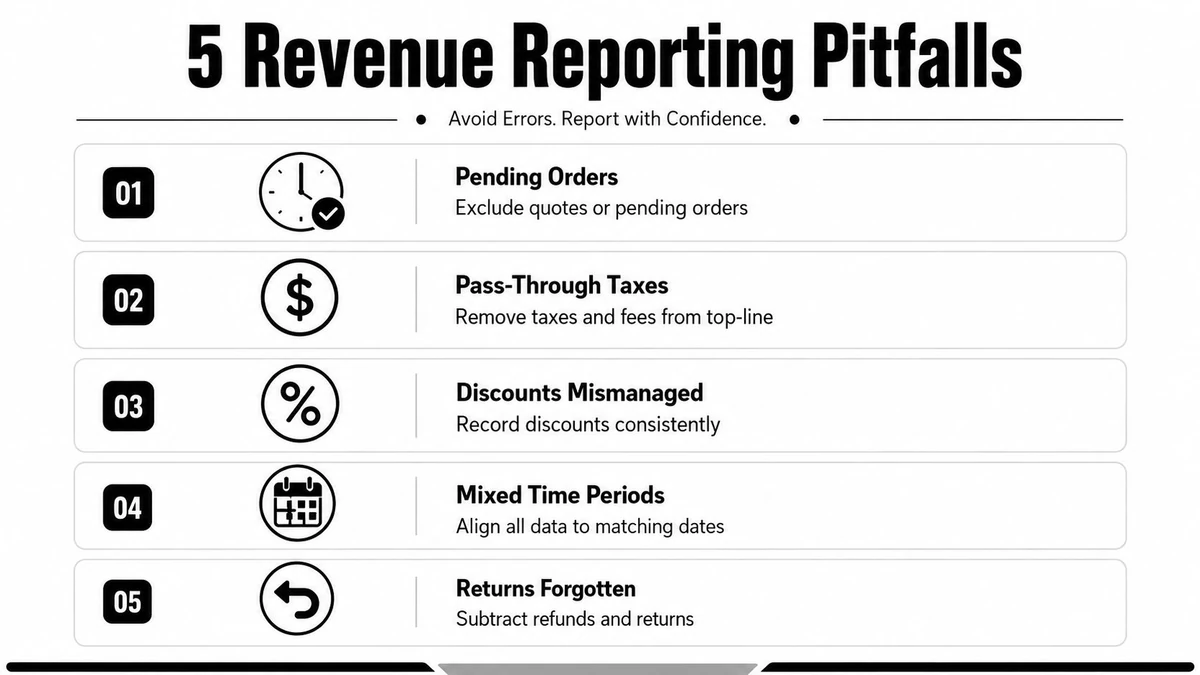
The five most common errors are usually easy to spot once you know where to look. Teams count quotes or pending orders too early, fold pass-through taxes and fees into top-line revenue, mix periods across systems, forget returns, or double-count renewals that were already recognized. The fix isn't more complicated math. It's a tighter pre-close habit.
A quick verification routine
Before the leadership review, check that every transaction is completed, every date falls inside the chosen period, and every deduction is classified once. Then compare gross sales, deductions, and net revenue against the source export. If the numbers don't tie, stop and find the row that slipped in or out of scope.
- Pending Orders: exclude quotes and unfulfilled orders.
- Pass-Through Taxes: remove taxes and fees that don't belong to the business.
- Discounts Mismanaged: apply discounts the same way every time.
- Mixed Time Periods: align all systems to the same dates.
- Returns Forgotten: subtract refunds and reversals in the correct period.
That checklist takes less time than explaining a bad report after the meeting starts. It also keeps the team from patching errors with manual edits that can't be audited later.
For teams that want a lightweight way to sanitize contact lists before revenue attribution, the Email Validation API is a practical reference point because it fits into automated checks rather than a separate cleanup project.
Tying Revenue Accuracy to Clean Contact Data
Revenue math gets blamed for problems that start upstream. If the contacts attached to orders, renewals, or campaigns are duplicates, stale, or fake, the report can still be arithmetically correct and operationally wrong. That's why clean CRM data belongs in the same conversation as revenue calculation, not in a separate hygiene meeting.
BillionVerify is a professional email verification service built to solve one problem, bad email data costs businesses money. Used well, a verification layer at signup and before campaign sends helps teams keep undeliverable contacts and weak records from polluting the same systems that feed revenue reporting.
For list cleanup, BillionVerify's cleaning tool fits naturally into the workflow because it supports the upstream step that makes the downstream math easier. Once contacts are verified, segmentation by verified versus unverified records gives a truer read on campaign-attributed revenue and reduces the noise that makes reconciliation harder.
If your revenue report keeps drifting, fix the inputs before you debate the math. Visit BillionVerify to add email verification to your signup flow, list cleanup process, or CRM workflow, so the revenue numbers you report are built on cleaner records from the start.